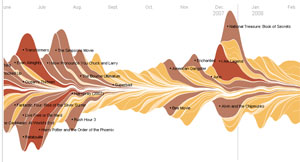
Over at the NY Times website, there’s an incredible demonstration of box office trends. It’s an interactive flash graph of every(?) movie from 1986 through 2007.
Rollover the peaks and valleys to see how much cash each movie made. If you move the slider at the bottom, you can go back all the way to 1986. I wonder how many films are listed? Hundreds?
Click the pic below: